
A tour of your dashboard
The sidebar, the date control, search, and how to move around the insight dashboard.
The insight dashboard is the heart of the platform. Everything you can open lives in one sidebar on the left, grouped under Today, Performance, Work and Studio, so the whole product is visible at a glance. One top bar carries everything: your company name on the left, then search, then a date control that sets the timeframe for everything on screen: the last 7, 30 or 90 days, or any dates you choose.
On a phone the same pieces take a different shape. The four areas sit in a bar at the bottom of the screen - Today, Performance, Work and Studio - with Ask beside them for the Brain. Under the top bar, one row says where you are, such as "Performance › CRM": tap it to see every tab in that area with its full name, search everything, or open Setup. The date control sits at the right of that row and opens a menu of the same choices. Nothing slides sideways, and nothing floats over the page.
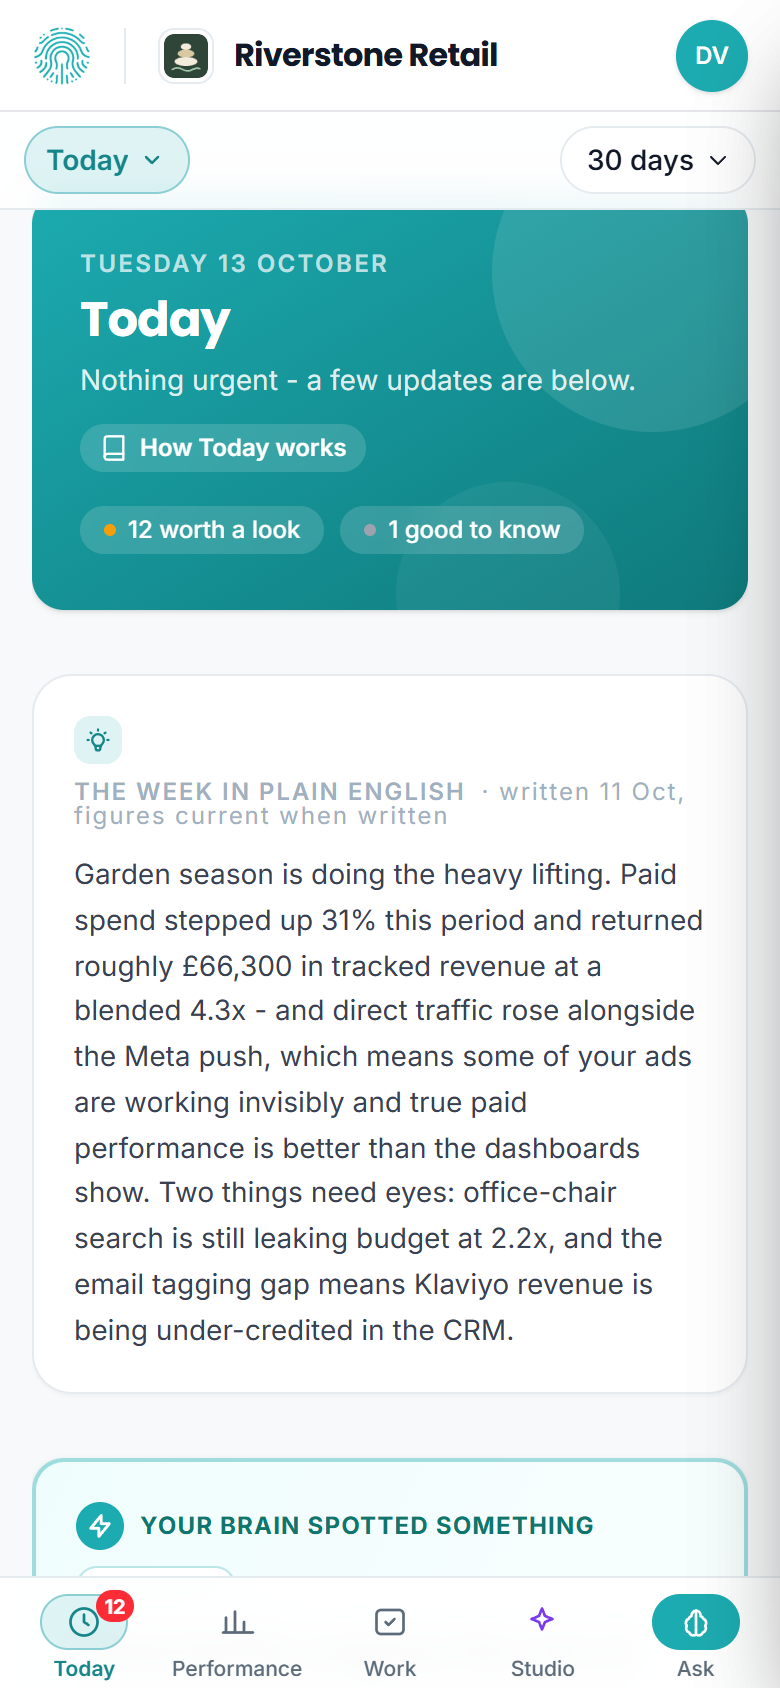
Today on a phone, in the demo workspace. The bar at the bottom is the same four areas as the sidebar on a computer, with Ask beside them.
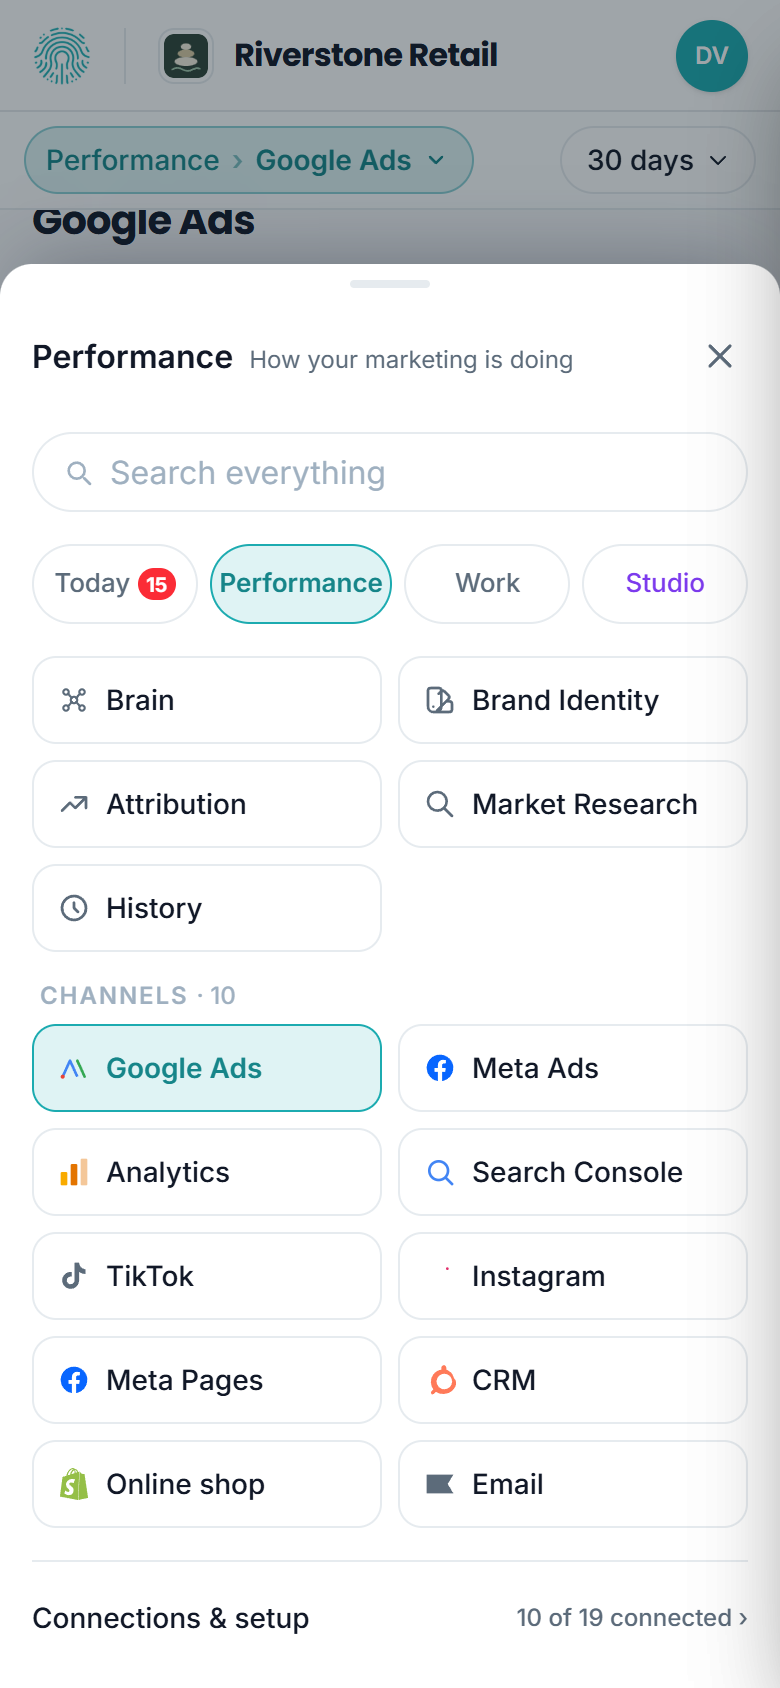
Tap the row that says where you are and the whole area opens as a sheet: search at the top, every tab with its full name, and Connections & setup at the bottom.
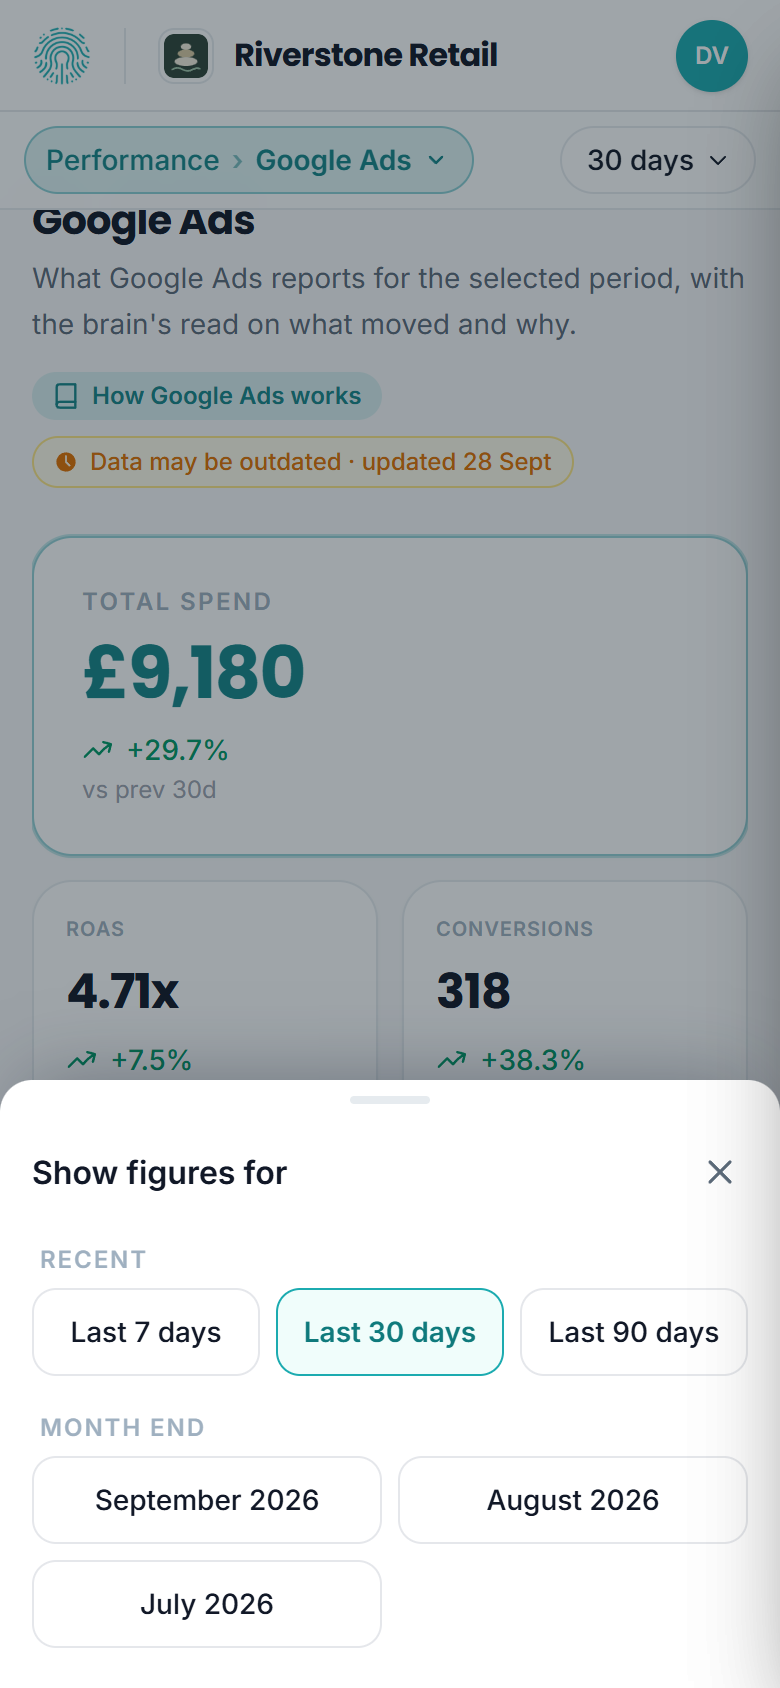
The date control opens the same choices as on a computer, as a sheet from the bottom: the recent windows, then the closed months.
Finding help on any tab
Help sits in the same places on every tab, so you never have to hunt for it:
- "How this works" - a small teal chip in the top-right corner of a tab, next to that tab's own controls. It opens the Help Centre article for exactly that tab, in a new tab. Empty pages carry the same link under their main button.
- (i) - a small teal circle straight after a section heading. Hover or tap it for a one-line explanation, and a Read more in the Help Centre link where a fuller answer exists.
- Dotted words - a term with a dotted underline shows its plain-English meaning on hover.
You do not need to know what something is called to find its help page: the link is next to the thing itself. The Get help button (top right on a computer; in your account menu on a phone) is still there for anything these do not cover.
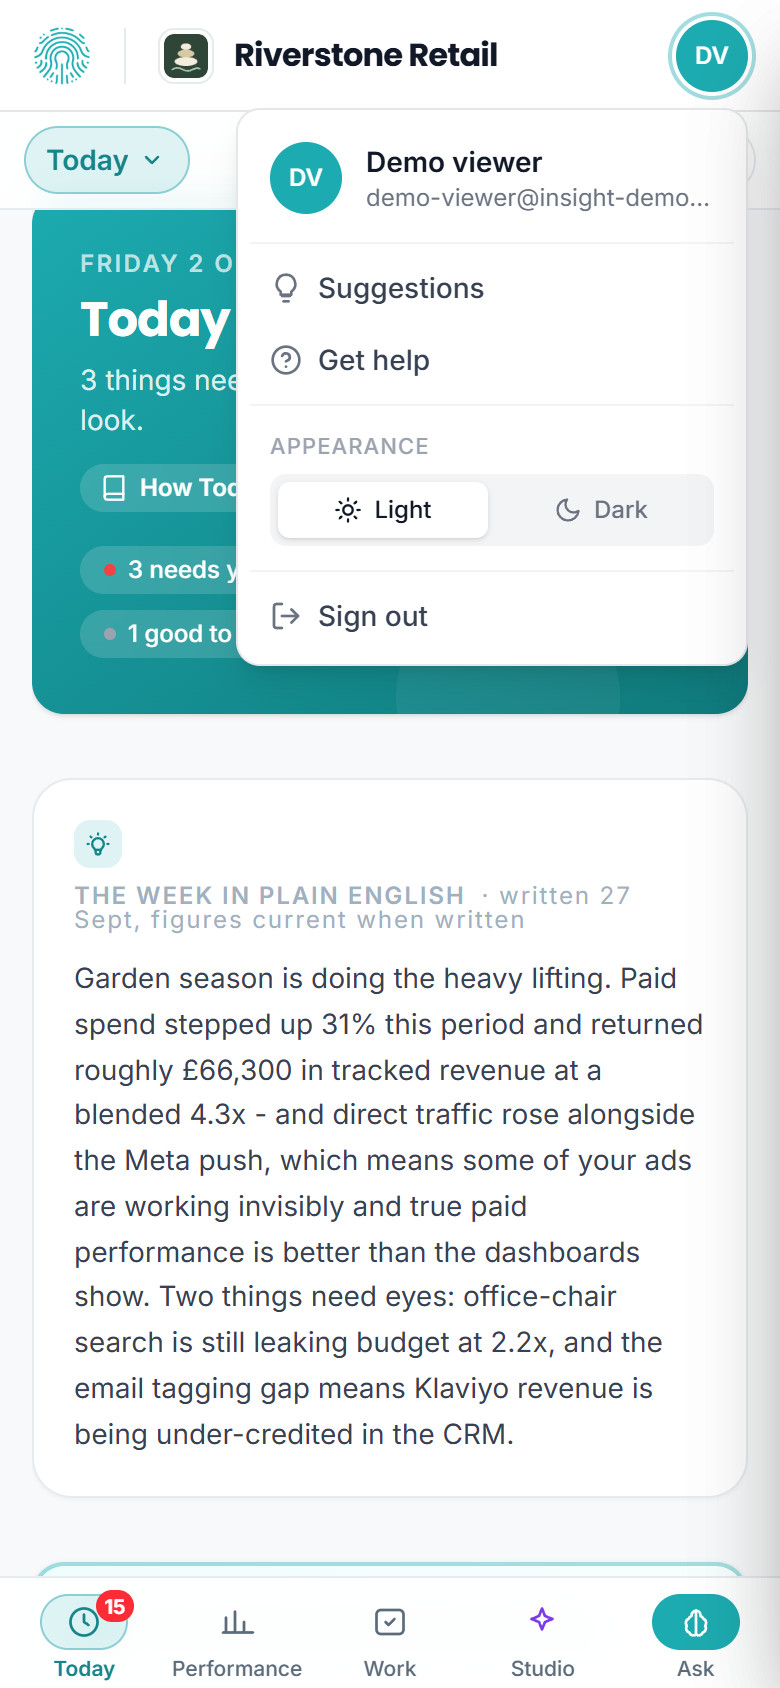
On a phone, Suggestions and Get help live in the account menu, opened from your initials top right.
Every tab, from Today to Setup, opens with the same layout: the area it belongs to in small capitals, the tab's name, one line on what it is for, and the help chip and that tab's own controls top-right. On a phone the controls sit under that line instead, and a tab with several of them folds them behind one Filters button.
Everything below is what your client sees on their insight dashboard. You can open it yourself for any client and, where supported, "preview as client" to see exactly their view. You also control which tabs are visible per client. See Running the agency.
Today
Your starting point: it leads with a single flagship insight - always something worth reading - above an inbox of things that need attention right now, such as new leads, open reports, budget alerts and questions from the Brain, grouped by urgency. Clear an item by acting on it or dismissing it. See Your Today feed.
Before you've connected anything, Today won't pretend there's nothing to do - it tells you to connect your accounts to start rather than saying you're all caught up. Once your automatic monthly report is scheduled, it also shows a "Next report: <date>" pill so you know when the next one lands.
Performance
How your marketing is actually doing:
- Brain - opens with your live knowledge graph and a box to ask it anything, then blended KPIs (revenue, spend, ROAS) and an AI summary of what changed. See Chatting with the Brain.
- Brand Identity - your mission, audience, voice, positioning, colours and logo. A core input the Brain and every AI feature build on - available on every plan. See Brand Identity.
- Attribution - the full-funnel view from impressions to closed deals.
- Channels - every connected channel in one place: Google Analytics, Search Console, Google/Meta/TikTok Ads, your CRM, email and more. Click it in the sidebar to open the list, or use the row of channel buttons at the top of any channel page to move straight between them.
- Market research - competitor and keyword intelligence.
Work
Where direction and delivery live:
- Storyline - your monthly targets and the story so far, month by month.
- Working on - the task list.
- Budget - off-platform spend and budget tracking. Marked Soon: see Budget.
Studio
Creator's Studio - the tools that make things: Copywriter, Social Calendar, Ad Studio and AI Search, with Web Concierge, Voice Outreach and others marked Soon. See What's in Creator's Studio. (Your brand details live in Brand Identity, under Performance.)
Getting around
- Use the date control in the top bar to switch between the last 7, 30 and 90 days, or to pick your own dates - see Custom date ranges below. Switching back restores your original view without a reload.
- Use search in the top bar to jump straight to any destination by name.
Ctrl+K(orCmd+Kon a Mac) opens it from anywhere. - Channels and, on the Insights plan, Studio fold away in the sidebar to keep it short. Click either to open it out; whatever you're currently looking at always stays visible.
- Setup in the sidebar is where you connect or check your platforms at any time. The number beside it is how many are connected.
- Any table you are looking at can be taken away as a spreadsheet: Export CSV sits top right of the table, next to its filter box. See Exporting a table to CSV.
Custom date ranges
The date control names whatever is selected - Last 30 days when you arrive - and opening it gives you two kinds of choice:
- Last 7, 30 and 90 days, at the top. One click, and the whole dashboard switches. These come from the platforms with every breakdown: campaign tables, top queries, top pages, top ads, and the revenue your CRM attributes to each channel.
- Any other range - This month, Last month, Last 3, 6 or 12 months, Year to date, or two dates of your own. Pick them on the calendar or type them (day first:
1/9/2026or1 Sep 2026), then press Apply. The ring around Start or End shows which date your next click on the calendar will set.
A custom range is built from the daily totals kept for each channel, which has three consequences worth knowing before you quote a figure:
- It covers Google Ads, Google Analytics, Search Console and Meta Ads, and - if your revenue comes from Manual Uploads rather than a connected CRM - your sales, on the CRM tab. On any other tab a banner tells you the tab is still showing the last 30 days; on a phone that note sits under the tab name and stays in view as you scroll, and the date control is outlined rather than filled while the range is not in force on that tab.
- With sales covered, the Attribution tab shows your return on advertising for the dates you picked: revenue from the channels you pay for, what you spent, and the ratio between them. It is worked out exactly as on the 7, 30 and 90 day views, so the two never disagree about what the figure means. If a return cannot be worked out for your dates the tab says why - for example, TikTok Ads spend is only available for the fixed periods, and a return that left it out would flatter you - and still shows the revenue and spend it does hold. The funnel, revenue by channel, top deals and tracking coverage stay on the fixed periods.
- If your revenue comes from a connected CRM, custom dates do not reach your sales or your return on advertising yet; those tabs keep showing the last 30 days and say so.
- It shows headline figures and the daily trend, not the breakdown tables. "Which campaign spent the most in August" is a 7, 30 or 90 day question; the range view says so and links back.
- Users, reach and frequency are left out, because they count individual people and cannot be added up from daily figures. The chart still shows users per day.
Changes are always compared like for like, and the line under the heading says exactly which days were compared. A range that includes the last two or three days is compared over the days that have settled, because the platforms are still revising the most recent ones; the view tells you how many days its figures cover.
A custom range is part of the page address (?range=2026-09-01..2026-09-10), so you can send a colleague the exact view you are looking at, and Back returns you to where you were.
Looking back at a past month
Once you have at least one complete month of history, a Pick month button appears beside the date control. Choose a month and the whole dashboard shows that month's figures, compared with the month before it. A banner at the top of the page says which month you are looking at, so it is never mistaken for live data.
- Which months are offered. Finished months only - never the one in progress - and only a month in which at least one of your channels has 15 or more days of figures. The most recent 24 are listed, newest first.
- What a past month shows. Headline figures. Charts, campaign tables, top pages and other breakdowns are kept for the live 7, 30 and 90 day views only, so on a past month those sections are empty rather than wrong.
- Users and reach. These count individual people, so a month's figure cannot be added up from its days - the same person on two days is one person. A past month shows the platform's own count for the 30 days up to the end of that month. If the platform's count was never recorded for a month, the dashboard shows the sum of the days instead and the banner tells you it is an upper estimate.
- Going back to live. Open the date control and choose Last 7, 30 or 90 days.
A past month and a custom date range answer different questions. A past month is a fixed record of how the month ended, compared with the month before. A custom range is any dates you like, built from daily totals, compared with the same number of days immediately before.
Keep an eye on the top of the dashboard - it surfaces things you'd otherwise have to go looking for:
- A "Trial - N days left" chip sits next to the date control while you're trialling, with a Choose a plan button straight to Settings. Your trial deadline lives here on the dashboard, not buried in Settings.
- A "Your latest report is ready" banner when a fresh monthly report publishes - see Automatic reports.
- A "Connect your accounts" banner until you've connected your first data source.
On the Insights plan, Studio appears in the sidebar with a padlock. Open it to see the tools it contains - Copywriter, Social Calendar, Ad Studio and AI Search, plus the ones marked Soon - and click any of them to see what the tier includes. See Plans, pricing & billing to unlock it.